HW3 · Did the May forecast survive the summer?
Out Sun Oct 25 · due Fri Oct 30, 11:59 pm
AI assistance is recommended on this one. Use it, disclose it, and write the note yourself.
The question
Every month USDA’s World Agricultural Supply and Demand Estimates (WASDE) project the U.S. corn yield and the price farmers will receive. The first projection for a crop comes in May and is revised every month until January. In May 2012 USDA projected 166.0 bushels per acre; the drought brought it to 123.4. How did the May forecasts of yield and price hold up from 2000 to 2026, and what did the world price do meanwhile?
Target
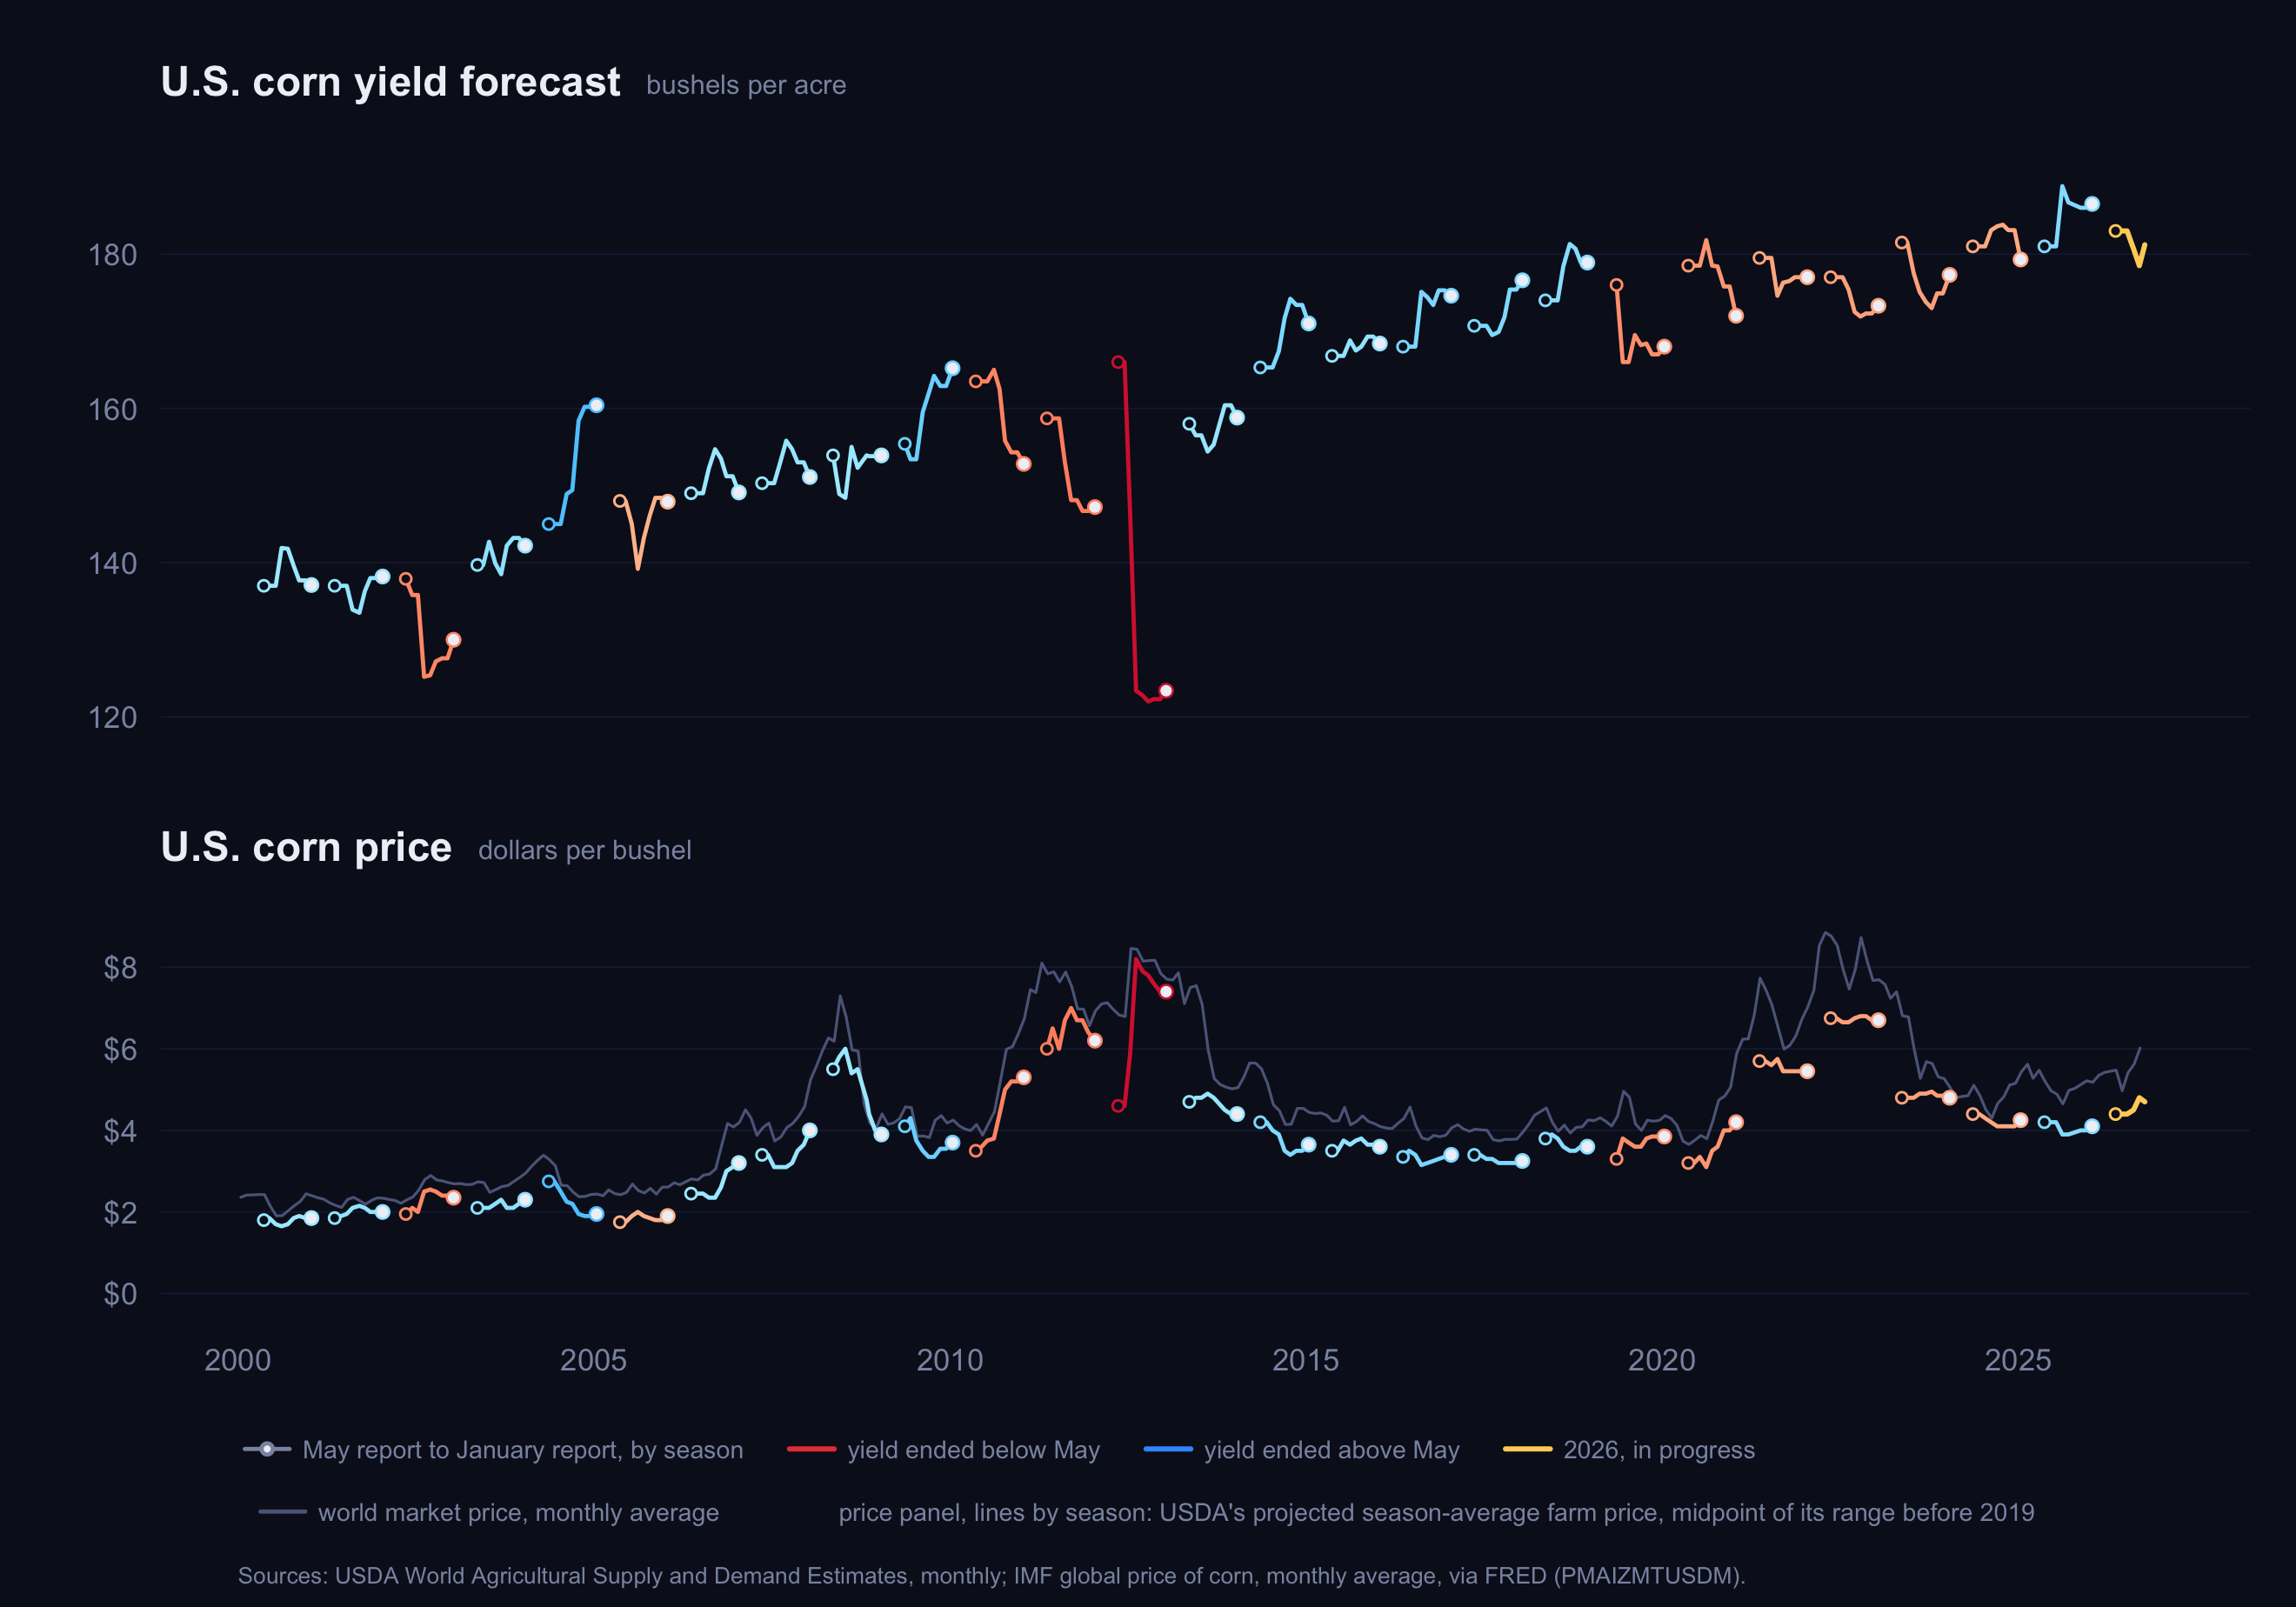
Data
- The list of WASDE reports: an API. USDA’s ESMIS archive returns every report since 1973 as JSON, 25 per page, with the URLs of each report’s files: https://esmis.nal.usda.gov/api/v1/release/findByIdentifier/wasde?latest=false&page=0
- The reports themselves: downloads, read with regular expressions. Take the
.txtfile of each report, or the.xmlwhen there is no text. The yield and the price are in the CORN block of the table “U.S. Feed Grain and Corn Supply and Use”. - The world price of corn: a CSV. FRED series
PMAIZMTUSDM, dollars per metric ton (one ton is 39.368 bushels): https://fred.stlouisfed.org/graph/fredgraph.csv?id=PMAIZMTUSDM
USDA’s robots.txt asks for ten seconds between requests. Save every file you download and never download it twice. Save each report under data/wasde/ plus the part of its URL after release-files/, so …/release-files/3t945q76s/ms35t8930/t435gd264/wasde-08-10-2012.xml goes to data/wasde/3t945q76s/ms35t8930/t435gd264/wasde-08-10-2012.xml.
Output
figures/hw3_target.png, 12 × 8.4 inches at 220 dpi.data_clean/corn_forecasts.csv: one row per report, with its date, season, yield and price.data_clean/corn_world_price.csv: one row per month.NOTES.md: how you chose the files, your patterns, your checks and what each would catch, and an AI disclosure (tools, uses, what you checked).
Figure rules
- One line per season, from the May report to the January report, each point at its report’s release date.
- Top panel: the yield. Bottom panel: the price projection (the midpoint when USDA gives a range), over the monthly world price in grey.
- Colour: warm when the January yield ended below May, cool when above, darker as the gap grows. The price line takes its season’s colour. The season still open is yellow.
- An open circle at May, a white dot at January, on a dark background.
Font, exact shades and the key’s layout are never differences.
How to submit
Your repository is hw3-<your github username> in the course organization. It holds only a README that links to this page; the project’s layout is yours to set up. Put the code in code/, with code/run_everything.R running it all, and paths relative to the project root. Commit as you go; the grader runs the last commit pushed before the deadline from a fresh clone.
AI on this one
Recommended. Ask for the script rather than the answer, check what it gives you, and disclose in NOTES.md which tools you used, for what, and what you checked. Undisclosed use is treated as an integrity violation.
Rubric
The course rubric, on the Homework page: five dimensions, three points each.