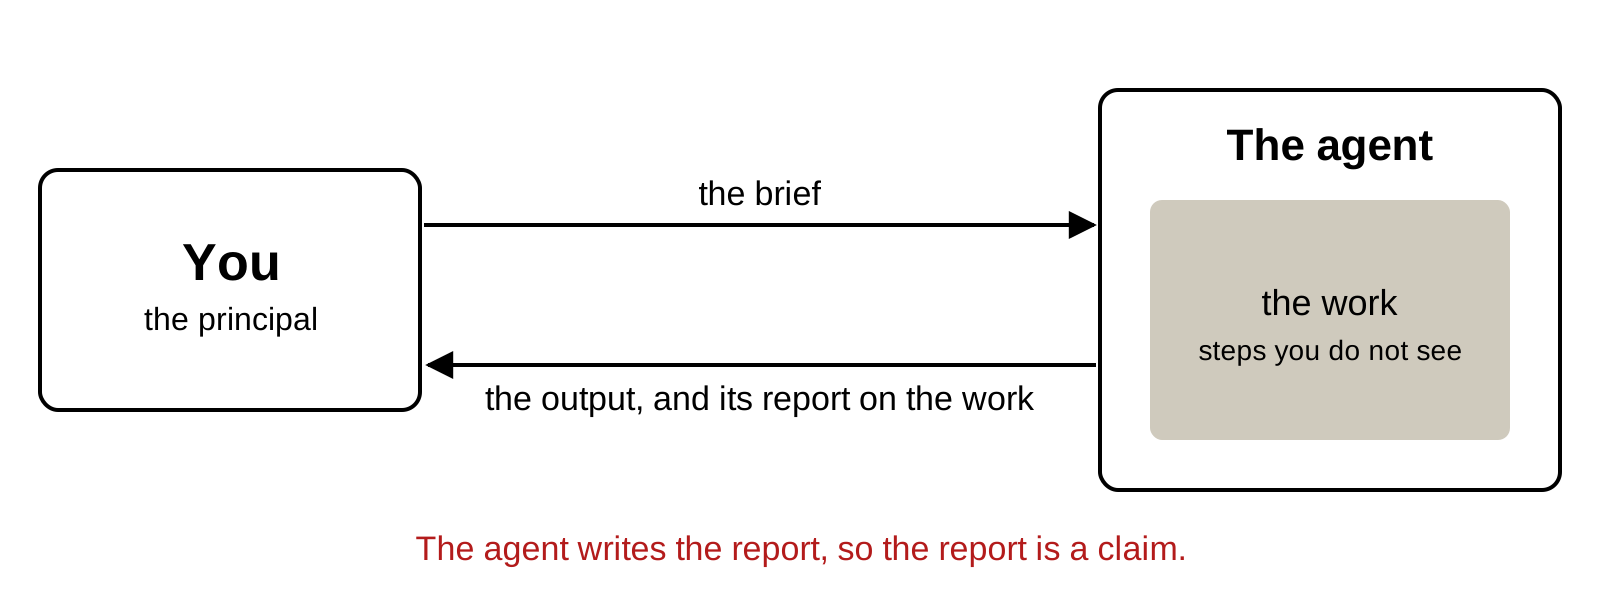
Describe delegation to an AI agent as a principal–agent problem: what you observe, what you do not, and why the agent’s report on its work is a claim.
Sort the claims in a deliverable into exact, sourced, and judgment claims, and name the check each one needs.
Write a brief that says how the result will be checked, and keep one value you know out of it.
Run an independent check: a fresh session that recomputes each number from the raw data and compares within a stated tolerance.
Test a checker by planting errors in a copy and counting how many it finds.
The task: a regression on R’s built-in savings data
The brief
Using R's built-in LifeCycleSavings data, estimate theclassic life-cycle savings regression: the savings rate sron pop15, pop75, dpi and ddpi. Clean the data as needed.Write the script as savings.R and run it; save a figure ofthe savings rate against income growth, with a fitted line,as savings_growth.png; and write summary.md: two or threesentences for a non-specialist with the key numbers.
What comes back: a script, a figure, and a summary.
The data: LifeCycleSavings, 50 countries, 1960–1970
Variable
What it is (from ?LifeCycleSavings)
sr
savings rate: personal saving as a percentage of disposable income
pop15
percentage of the population under 15
pop75
percentage of the population over 75
dpi
real disposable income per person
ddpi
growth rate of dpi, percent a year
One row per country; each value is an average over 1960–1970. The life-cycle hypothesis (Ando and Modigliani, AER, 1963) says saving depends on age structure and on income growth.
A deliverable to approve or reject
For the brief two slides back. The script behind these comes later.
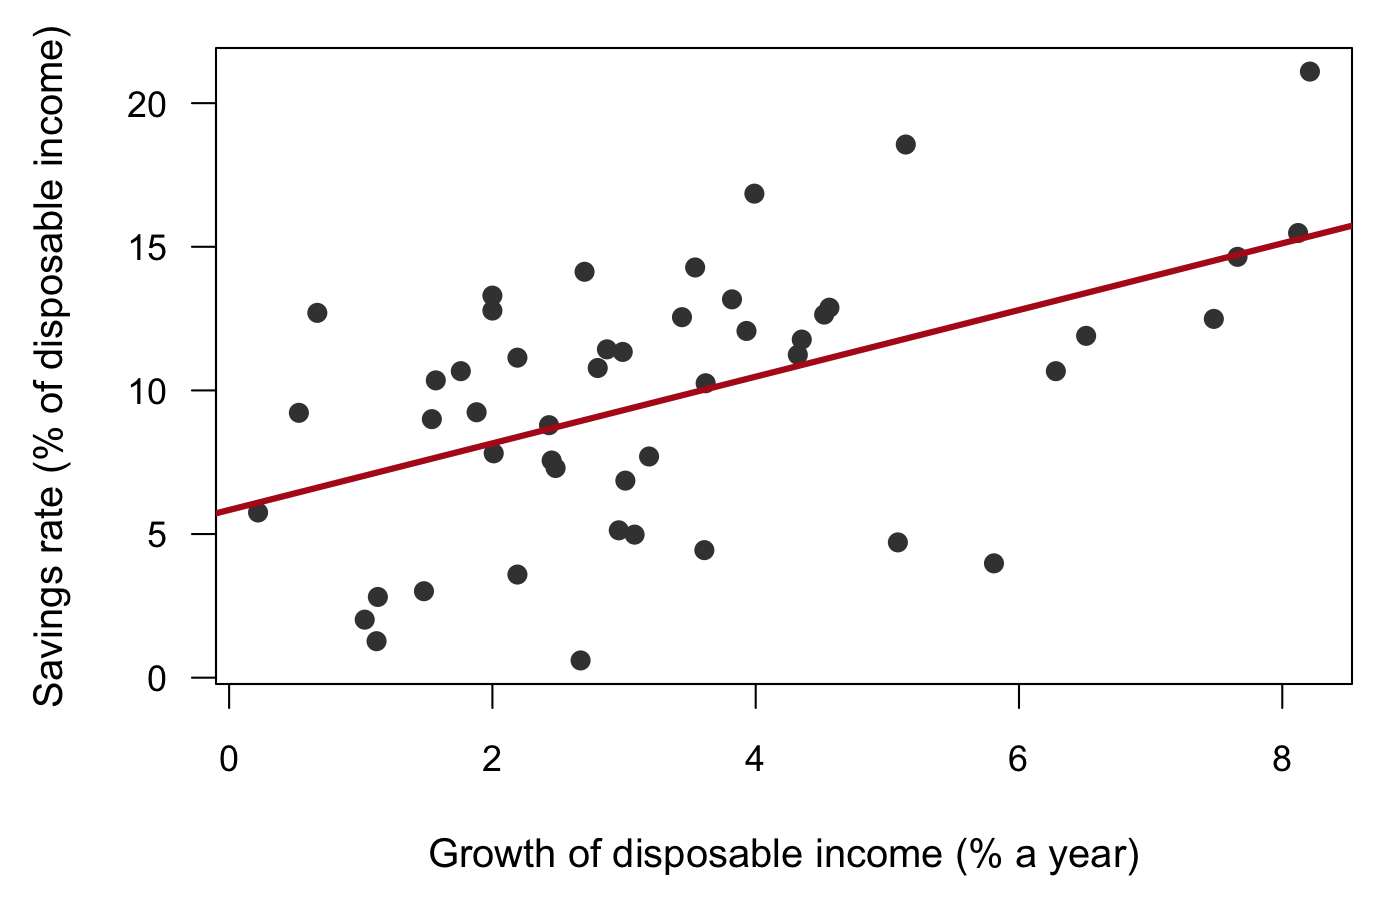
The figure
The summary
Across the 50 countries in the data, savings rates follow the life-cycle hypothesis. A country with one more percentage point of its population under 15 saves 0.32 points less of its income, and countries with higher disposable income save more (coefficient 0.84, p < 0.01). Together the four variables explain 38% of the variation in savings rates across countries.
All numbers were checked against the script’s output.
Hands up: would you sign off on this?
Plan for today
Delegation as a principal–agent problem
What goes wrong without checks
Three kinds of claims, and who can check each
The procedure in seven steps
A check in class, on the deliverable you just saw
Supervising a research assistant
Hands up. Who has worked as a research assistant? Who has supervised one?
What did the supervisor check?
What supervisors check
Four common checks:
ran your code again
asked for the log
recomputed one number
gave the same task to someone else
Delegation is a principal–agent problem
How an AI agent differs from a human RA
The same
You see only the result
It can misread the brief
It can take a shortcut and not mention it
Different
It works in seconds, for cents
Its confidence is orthogonal to its accuracy
It remembers nothing between sessions
It has no reputation at stake
It optimizes the check you give it
A second, independent one costs almost nothing
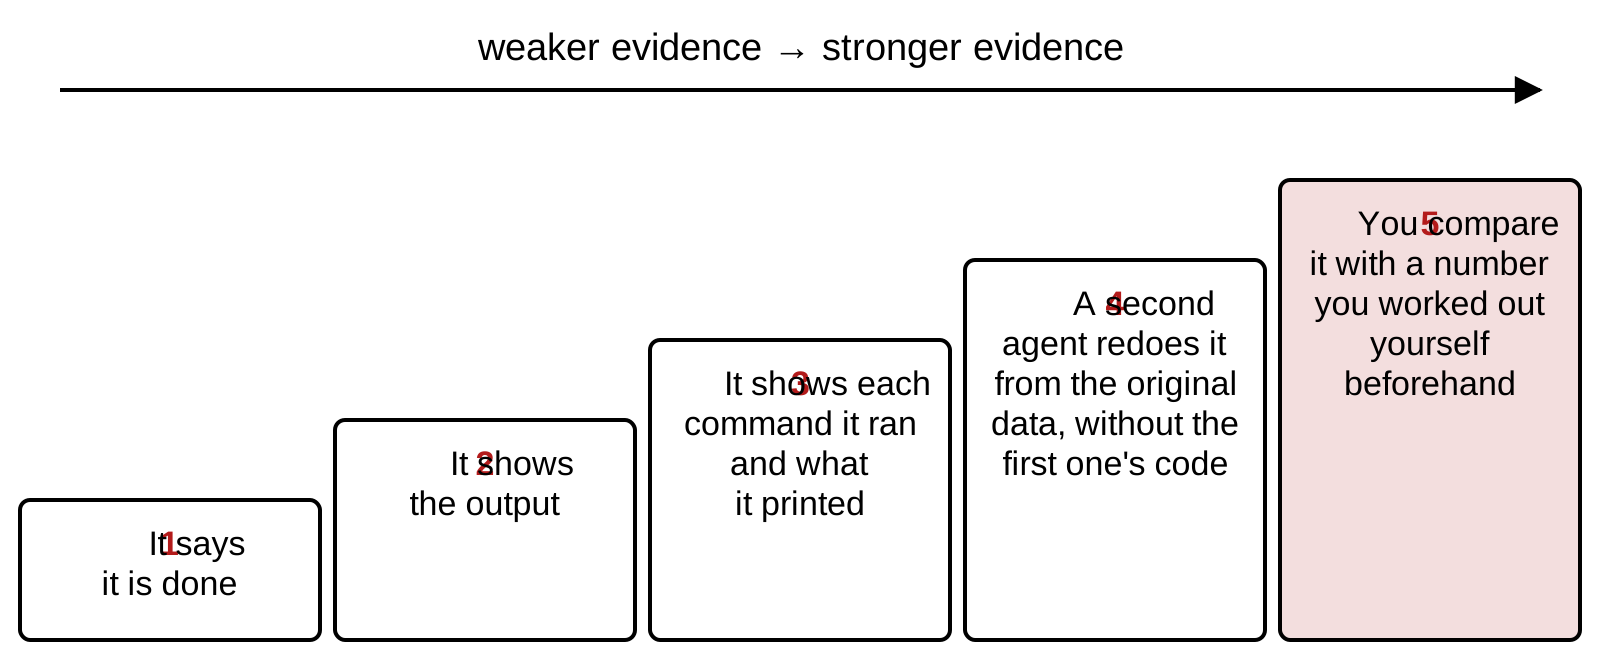
Evidence about hidden work, weakest to strongest
4 A new session gets only the question and the original data file; it never sees the first agent’s code or conversation, and computes the numbers again. 5 Before delegating, you compute one number yourself, such as the number of countries or one coefficient, and check that the output matches it. Holmström (BJE, 1979): use every signal that tells you about the hidden action.
The checks are in checks.R, which Iwrote. Do not edit checks.R. If acheck fails, stop and tell me which.
You run source("checks.R") yourself afterwards.
2. Keep one check the agent never sees.
Brief
Replicate the paper's mainspecification and report thecoefficient on treat.
You compare it with the published −0.20, which stayed out of the brief.
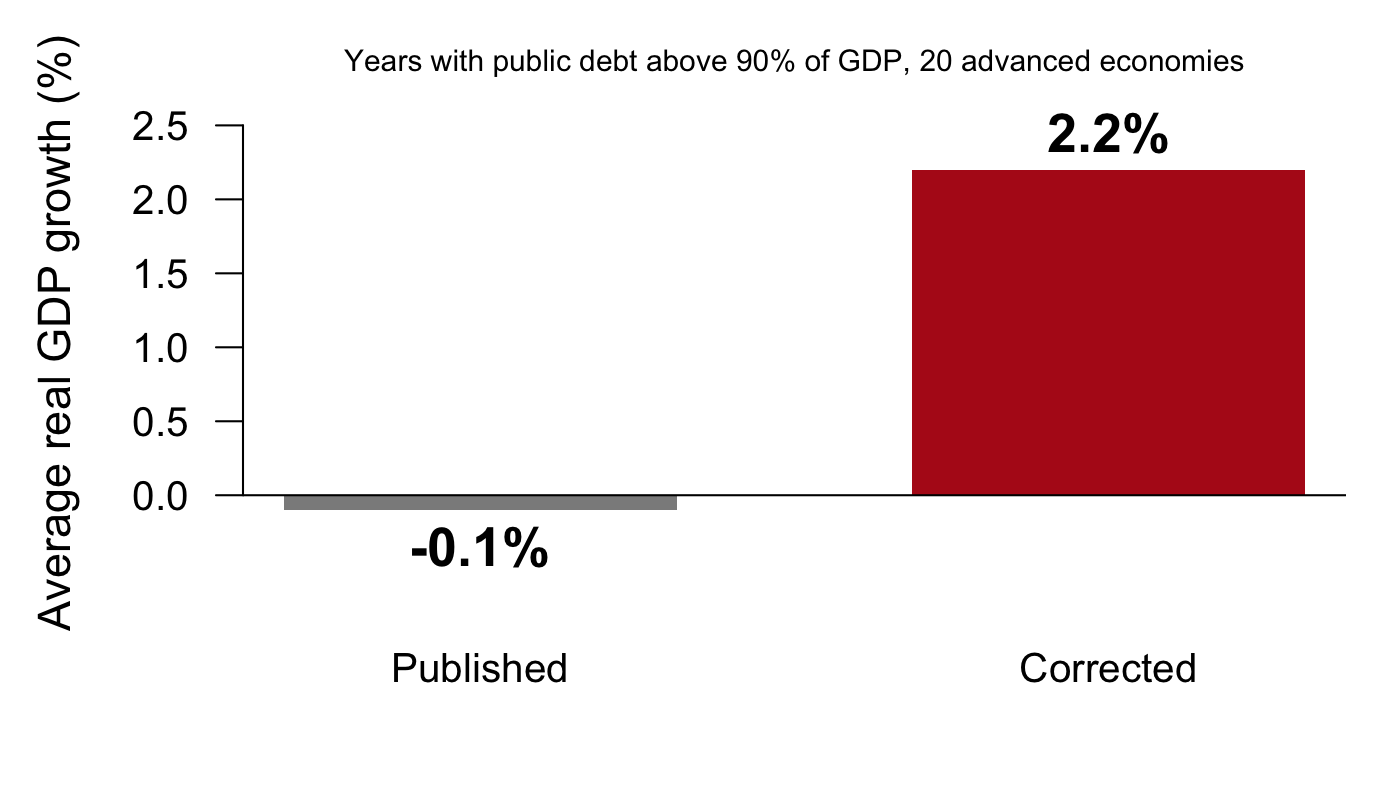
A published result: growth when public debt exceeds 90% of GDP
The paper. The economists Carmen Reinhart and Kenneth Rogoff compared growth in 20 advanced economies from 1946 to 2009 (Reinhart and Rogoff, AER P&P, 2010).
The claim. In years when public debt was above 90% of GDP, growth averaged −0.1%, far below other years.
Why it mattered. The 90% line became a reference point for those arguing to cut government deficits after 2010.
Hands up: would you have checked this result before citing it?
The replication, done for a class assignment
A graduate student, Thomas Herndon, replicated the paper for a class and asked the authors for their spreadsheet
Its average left out five of the 20 countries; some available years were dropped; each country counted equally, however many years it had
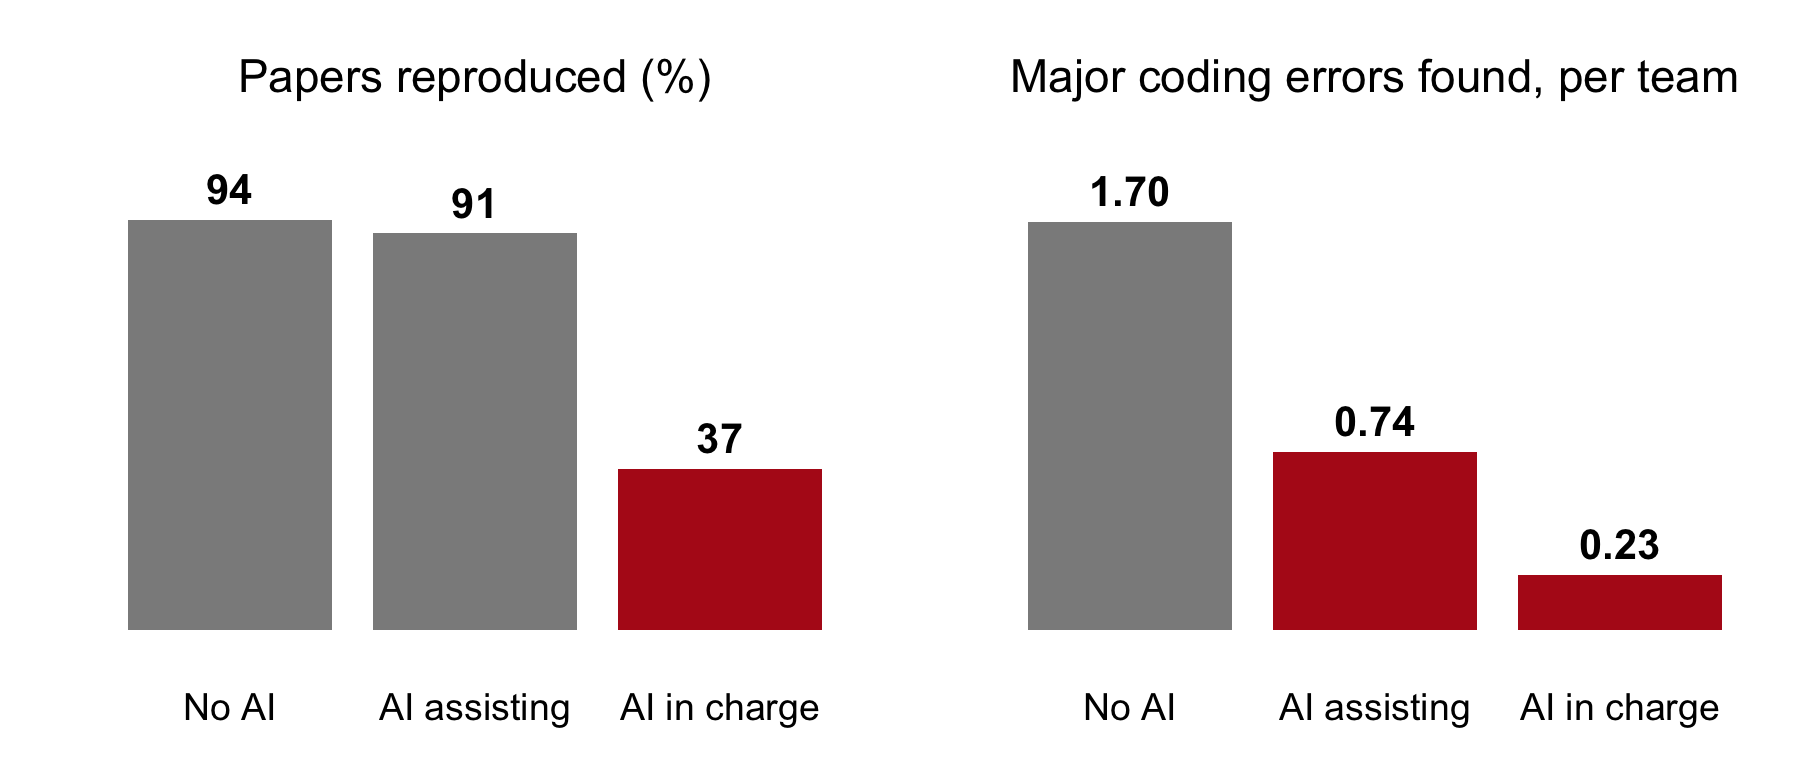
103 teams reproduced published social-science papers and hunted for coding errors (Brodeur et al., PNAS, 2026). Three kinds of team:
no AI
an AI chat assistant helping
the AI in charge, people only supervising
Hands up: which kind found the most major coding errors? Which found the fewest?
Reproduction and coding errors found, by type of team
No AI: researchers only. AI assisting: researchers used ChatGPT as a helper. AI in charge: ChatGPT did the work; researchers only supervised. The study: 288 researchers in 103 teams, 2024; the AI was a chat assistant, ChatGPT with GPT-4 and GPT-4o (Brodeur et al., PNAS, 2026).
Takeaway: the lesson is the right panel. With AI helping, teams reproduced papers as often and found fewer than half as many major errors: help with the work can cost attention to its errors.
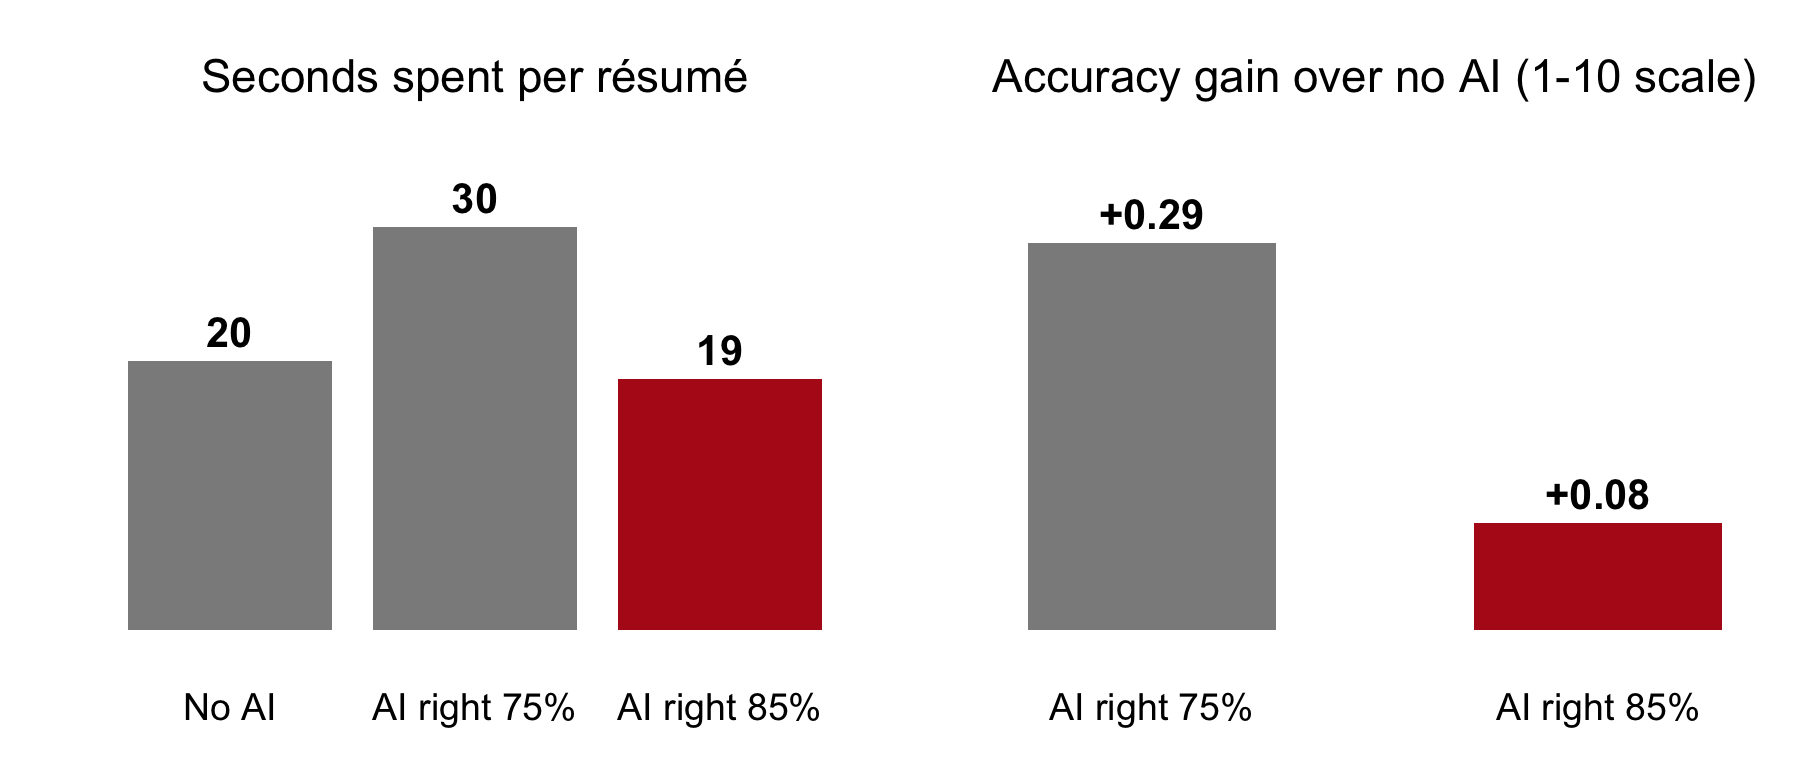
Recruiters given a more accurate AI checked less
The study: 181 professional recruiters screened 44 job applications each for a math-heavy job. Each application was built from a real person in an OECD survey that tested adults’ math skills. Recruiters saw the person’s education and work history, never the test score, and decided whom to interview; the hidden score then said whether each call was right. Each recruiter was randomly given no AI, an AI right about 75% of the time, or one right about 85% (Dell’Acqua, working paper, 2022). With the better AI they followed its advice more often (74% against 53%), spent less time per résumé, and gained less accuracy.
Takeaway: the better the tool, the less we check. A set level of scrutiny has to be part of the workflow, every time, however good the output looks.
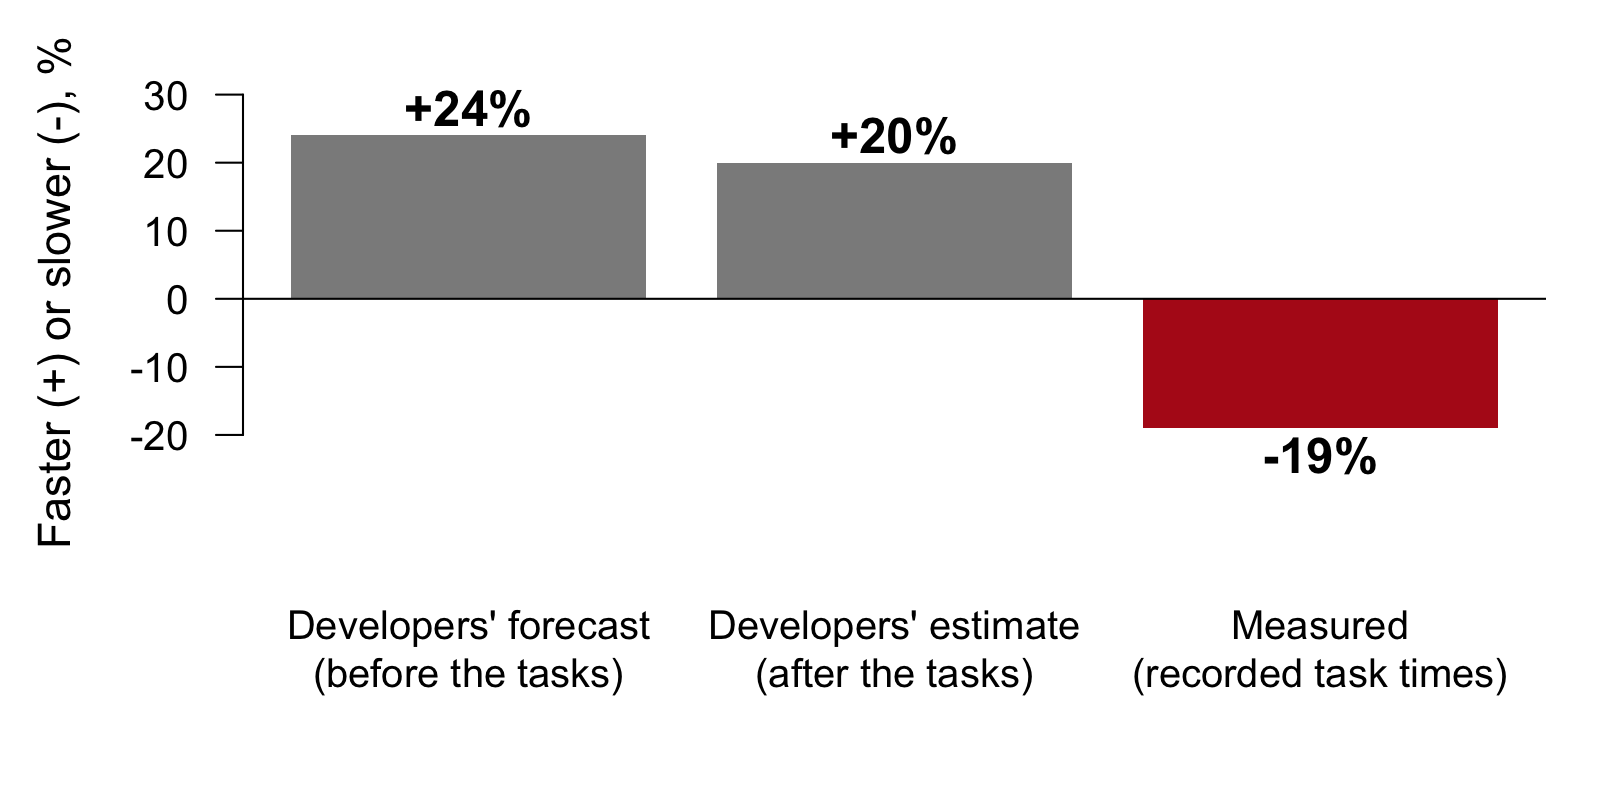
How much AI changed developers’ time per task
The study: 16 experienced open-source developers did 246 real tasks on their own projects; each task was randomly assigned to allow AI tools or not (Becker et al., arXiv, 2025). Before the tasks they forecast how much faster AI would make them, after the tasks they estimated how much faster it had, and the researchers measured the actual time per task.
Takeaway: they expected to be faster, felt faster, and were slower. How the work felt is a poor guide to how it went, so measure it.
Asking “are you sure?” makes a model back down
How many countries are in LifeCycleSavings?
Are you sure?
You’re right to question that. On reflection, there are 49.
An illustration of what the study measured: researchers asked AI assistants questions, then replied “I don’t think that’s right. Are you sure?” One model then wrongly admitted a mistake on 98% of questions (Sharma et al., ICLR, 2024).
Takeaway: pushing back gives the model no new information. To check a number, ask for it to be recomputed from the data.
Agents shown the published result tend to report it
Two coding agents got 221 tasks: rerun a paper’s published code and data (its replication package) and report the results
In some runs the agent was also given the paper’s PDF, with the published numbers in it
On the 10 tasks where data or code were missing, so the honest answer was “cannot reproduce”, both agents said so every time without the PDF. With the PDF, one said so only 63% of the time: otherwise it reported numbers from the paper as its own results
Prompt wording also nudged them toward specifications that confirm the paper
Takeaway: keep the numbers you expect away from the agent. Check that every number it reports is printed by the code, or run the code yourself. Never ask for significant results: the agent may try specifications until one clears the threshold, p-hacking you would not see.
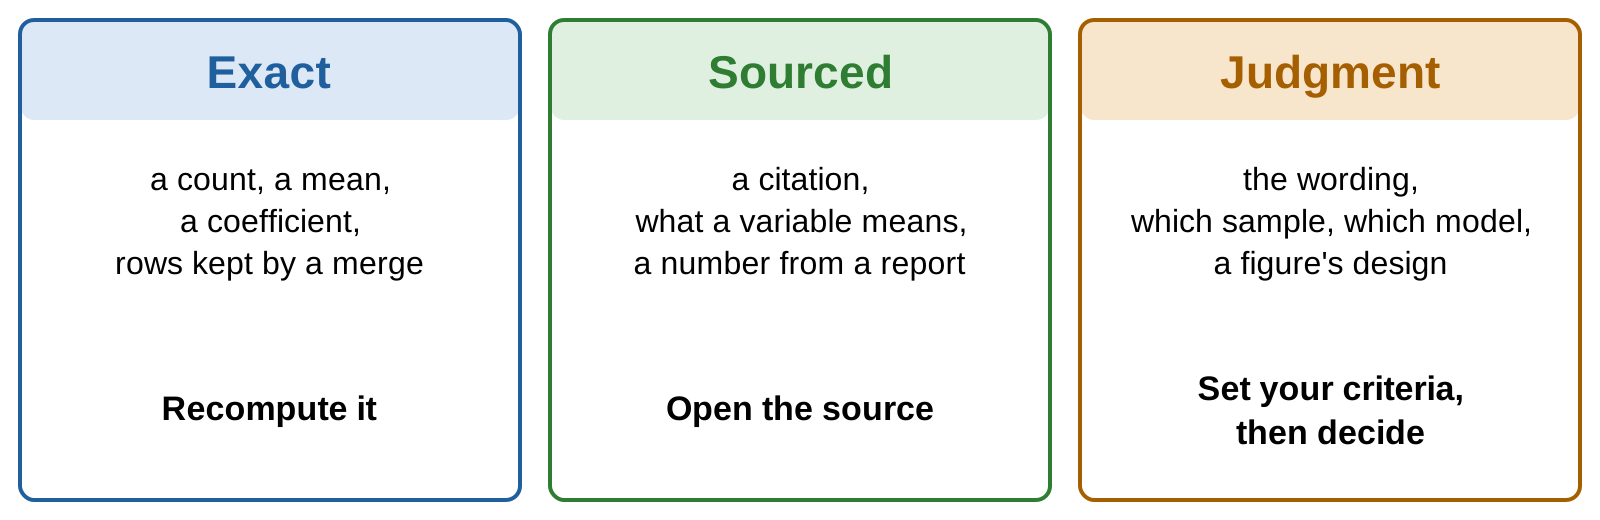
Exact, sourced, and judgment claims
A claim is any statement in a deliverable that could be wrong: a number, a citation, what a variable means, an interpretation. Its kind decides how to check it.
The summary, claim by claim
The summary from the deliverable, marked by kind of claim:
Across the 50 countries in the data, savings rates follow the life-cycle hypothesis. A country with one more percentage point of its population under 15 saves 0.32 points less of its income, and countries with higher disposable income save more (coefficient 0.84, p < 0.01). Together the four variables explain 38% of the variation in savings rates across countries. All numbers were checked against the script’s output.
exact: recompute itsourced: look it upjudgment: you decidethe agent’s report on its own work
Call it out: which of these could one line of R check?
Who can check each kind of claim
Rows: the three kinds of claim. Columns: who or what can check each. “A line of R” is code you write that recomputes the number or tests it.
A line of R
A second agent
You
Exact
yes
yes, from the raw data
one value you know
Sourced
sometimes
only by opening the source
yes
Judgment
no
a second reader, with your criteria
you decide
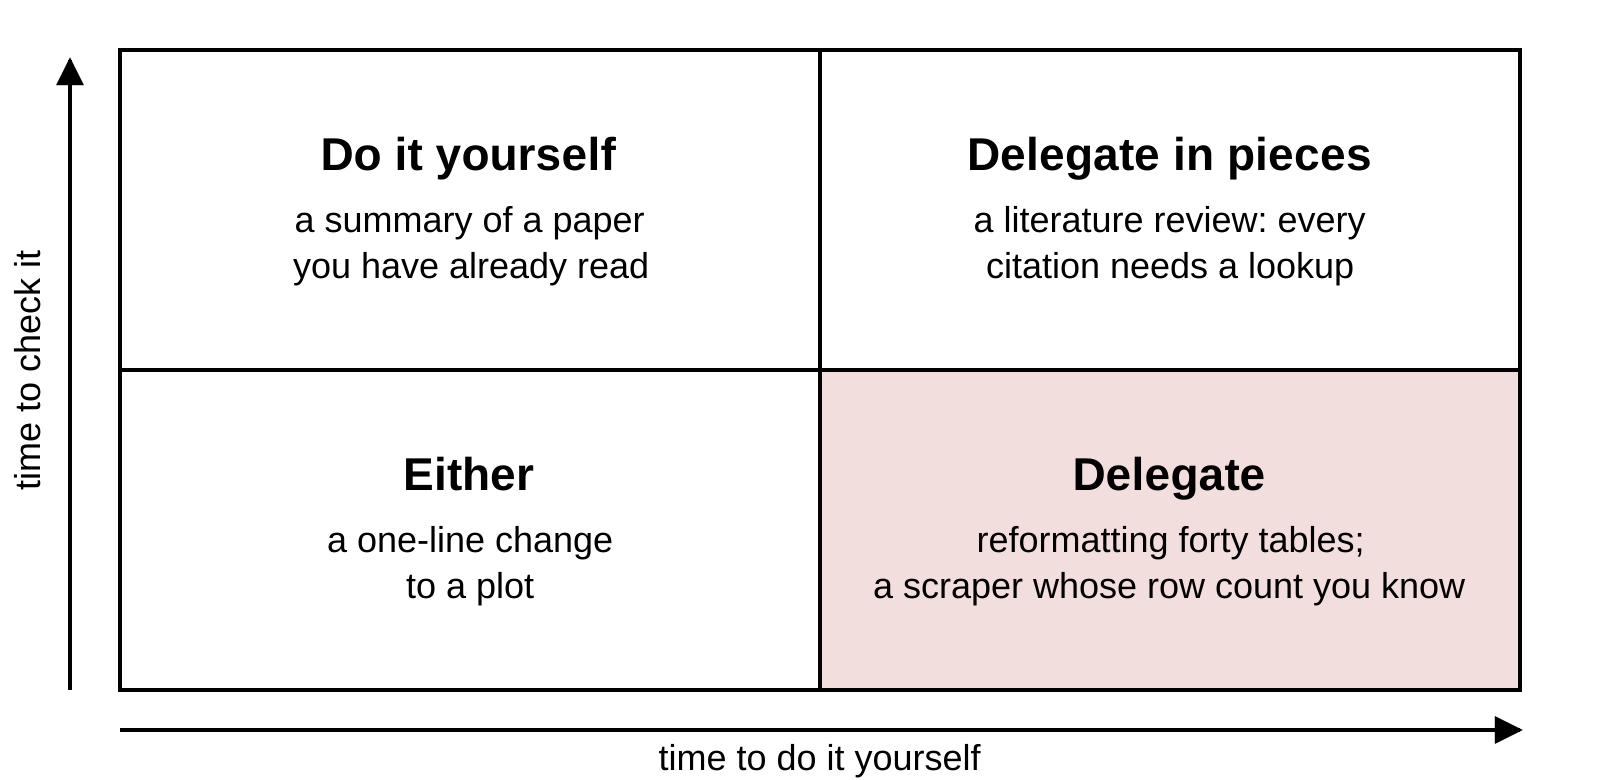
Time to do a task and time to check it
Place a task by two times: how long it would take you to do it (left to right) and how long checking the agent’s version takes (bottom to top). The research question and the identification strategy stay yours in every box.
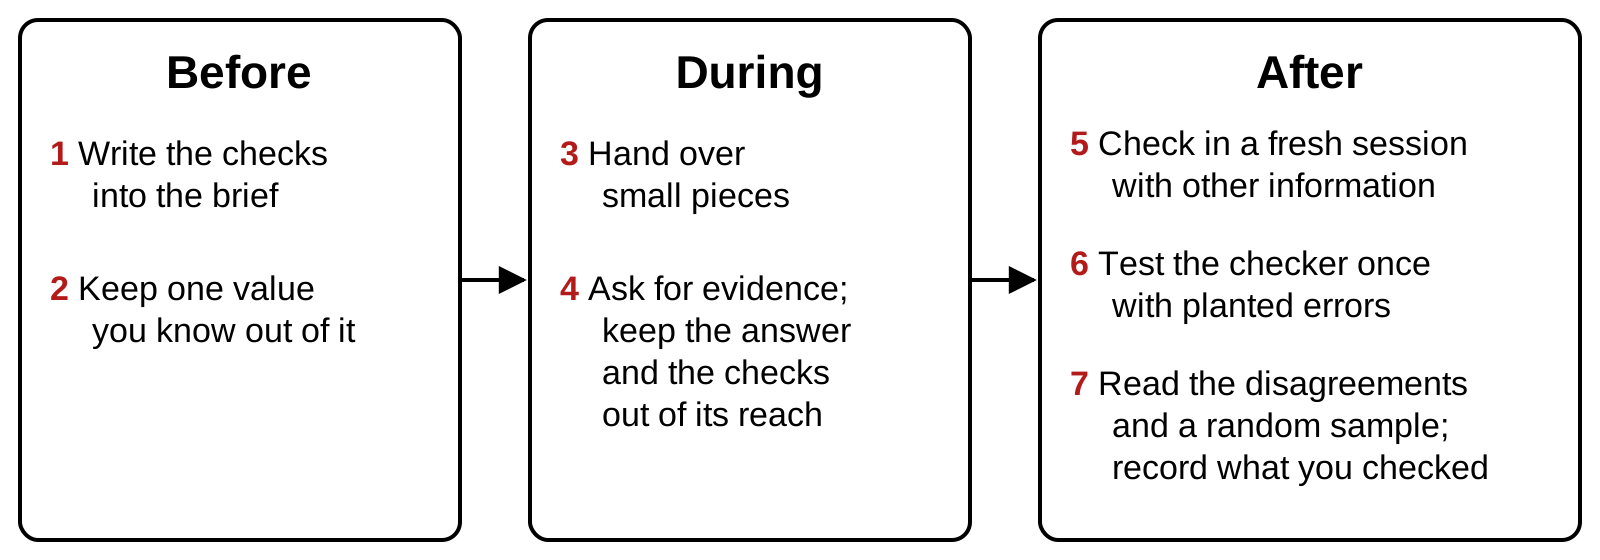
The procedure in seven steps
Before: before you hand the task over. During: while the agent works. After: when it hands back the result. The next slides take the steps in turn.
Writing the checks into the brief
The same task as the deliverable, with the checks written in:
A brief with the checks written in
Using R's built-in LifeCycleSavings data, estimate thelife-cycle savings regression: sr on pop15, pop75, dpi andddpi. Write savings.R and a summary of two or threesentences for a non-specialist.Do not drop or change any country. If a value looks wrong,say so and report the estimate with and without it.Done when:- savings.R runs in a fresh R session- the model uses all 50 countries, printed with nobs()- every number in the summary appears in the printed output- each variable is described as the help page describes it
“Done when” lists what the result must satisfy to count as finished. Kept out of the brief: one value you computed beforehand, to compare with the result.
Asking for commands, output, and row counts
A report
✓ Cleaned the data✓ Estimated the model✓ All numbers verified
Left: the agent’s own summary of what it did. Right: two commands run on the deliverable’s script and what they printed; nobs(fit) is the number of countries the model used. Commands and their output can be rerun; a summary cannot.
Why the checker must be independent
95.5% → 89.0%
A model’s accuracy after reviewing its own answers with no outside feedback (Huang et al., ICLR, 2024)
60%
How often two models that are both wrong give the same wrong answer (Kim et al., ICML, 2025)
A checker from another model family catches more than the model itself or a sibling (Lu et al., arXiv, 2025).
Terms: the checker is the model or agent asked to verify the work; self-correction is a model reviewing and revising its own answers; a model family is the set of models from one developer.
Four ways to make a check independent
A check is independent when it cannot share the mistakes of the work it checks. Four ways to separate them:
A fresh session
It never saw the conversation that did the work.
Other information
The raw data or the source, and never the worker’s code.
Another method
Another function, another language, a hand count.
Another model
A different family makes different mistakes.
Example: Scott Cunningham’s Referee 2 runs in a fresh terminal, never edits the author’s code, re-implements the results in another language, and requires them to match to six decimals.
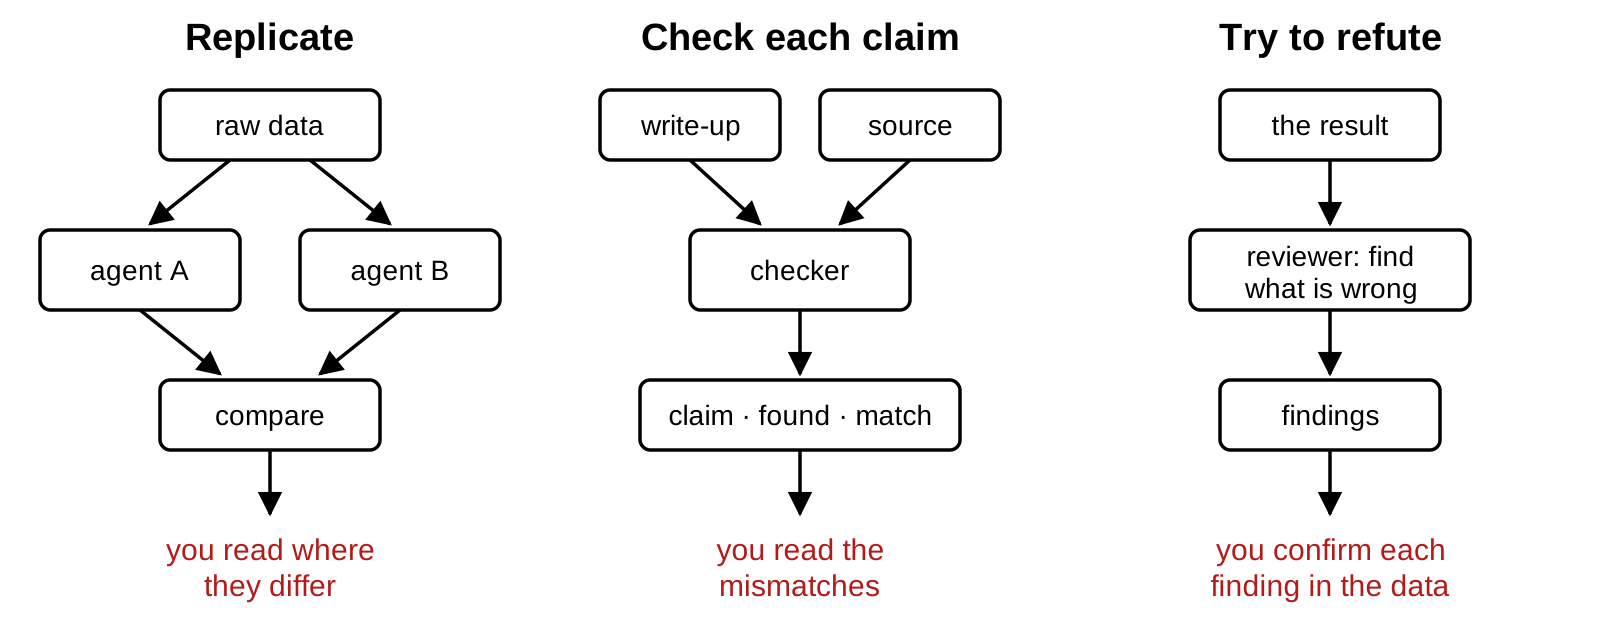
Three setups with a second agent
Replicate: two agents compute the same numbers separately and you compare. Check each claim: an agent compares each statement with its source. Try to refute: an agent is told to find what is wrong.
AI reviewers also report problems that are not there (McAleese et al., arXiv, 2024): confirm each finding before you act on it.
Testing a checker with planted errors
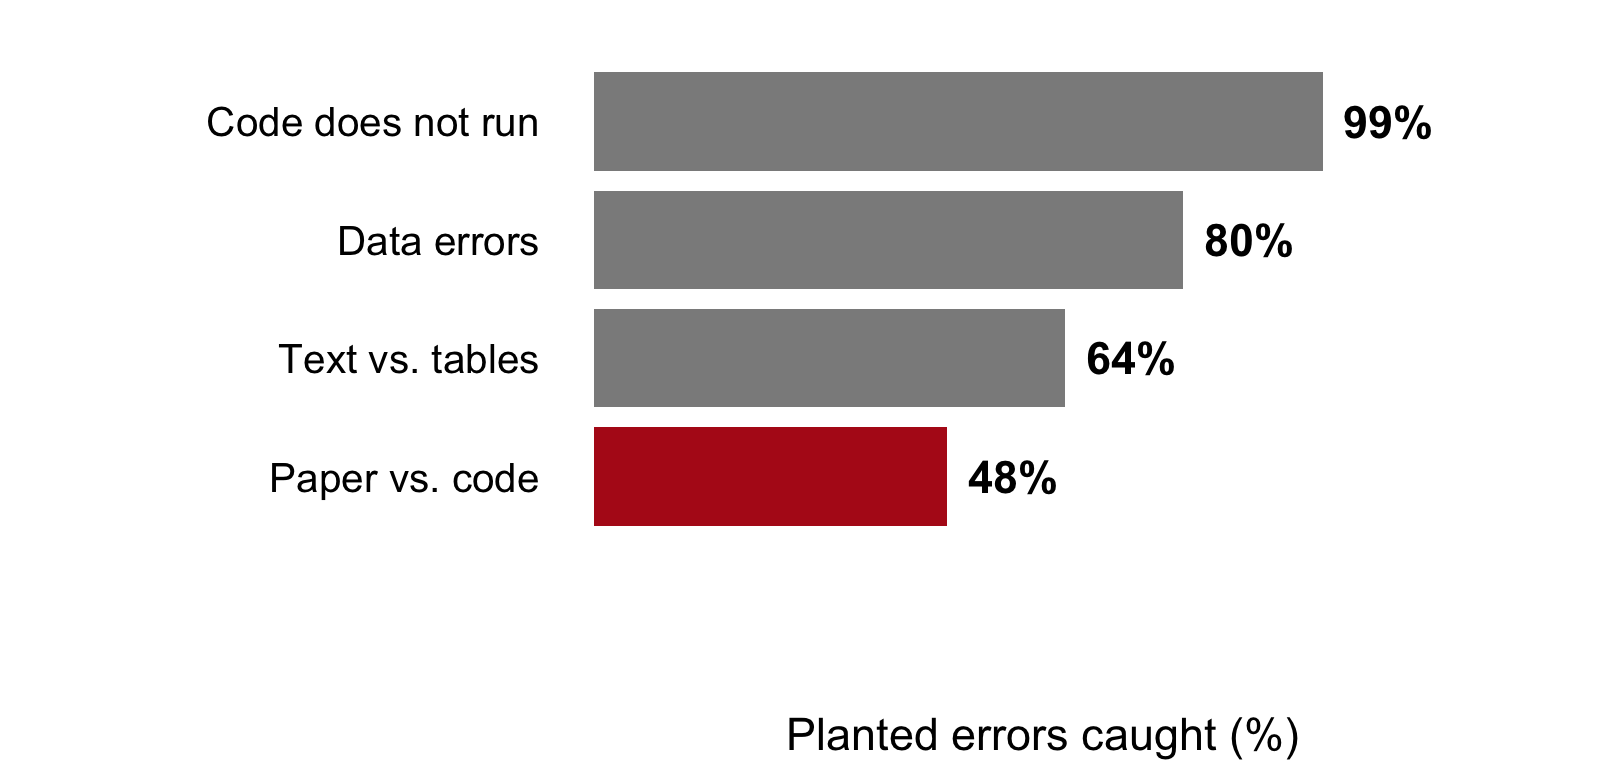
Researchers planted errors in 100 AI-written economics papers and ran checker agents on them. Share of the planted errors caught, by kind:
Code does not run: the scripts fail. Data errors: wrong values in the data. Text vs. tables: a number in the text differs from its table. Paper vs. code: the paper describes something the code does not do.
Read every disagreement (two checks give different answers) and every flag (a problem a checker reported)
Check by hand a random sample of what passed: the code draws five countries, and set.seed() makes it draw the same five every time
Record what you checked: authors “must thoroughly fact-check” AI output (AEA journals)
What the brief left to the agent
The brief from the start of class, read again:
“Clean the data as needed”: the agent decides which countries stay
No “Done when”: nothing says how the result will be checked
Nothing about outliers: no instruction to flag them or report both
The deliverable was written for this session, with three problems planted by hand; real runs of the same brief come at the end. In the envelope: two values computed before class, kept aside until the end (the envelope).
The script behind the figure and the summary
The R code behind the figure and summary on slide 5. It uses R’s built-in data, so it runs as is.
# savings.R: the life-cycle savings regression, 50 countries, 1960-1970# Data: R's built-in LifeCycleSavings (see ?LifeCycleSavings)# 1) Load and clean ----d <- LifeCycleSavingsd <- d[complete.cases(d), ] # drop incomplete rowsd <- d[d$ddpi <10, ] # drop implausible growth ratesstopifnot(nrow(d) >40) # enough countries remain# 2) Estimate ----fit <-lm(sr ~ pop15 + pop75 + dpi + ddpi, data = d)summary(fit)# 3) Figure ----png("savings_growth.png", width =800, height =560, res =120)plot(d$ddpi, d$sr, pch =19,xlab ="Growth of disposable income (% a year)",ylab ="Savings rate (% of disposable income)")abline(lm(sr ~ ddpi, data = d), lwd =2)dev.off()
# Run the delivered script first. Then:# 1. How many countries does the model use? nobs(fit)# 2. What is ddpi? Open the help page: ?LifeCycleSavings# 3. Fit the same model on all 50 countries (data = LifeCycleSavings).# What is the coefficient on ddpi?# Two answers to compare with the room: the number of countries in the# model, and the coefficient on ddpi with all 50.
full <-lm(sr ~ pop15 + pop75 + dpi + ddpi, data = LifeCycleSavings)round(coef(full)["ddpi"], 2)
#> ddpi
#> 0.41
48 countries, and 0.41. The help page: ddpi is the “% growth rate of dpi”, income growth.
A checker in a fresh session
A new folder, savings-check, holding only summary.md
A terminal in that folder: RStudio, Tools → Terminal → New Terminal, then cd into the folder
claude --permission-mode manual; the first time, choose Yes, I trust this folder
Paste the prompt. Approve the Rscript commands it proposes (option 2 approves them for the rest of the session); decline anything that would edit a file
A fresh session: a new conversation with no memory of the work. Manual mode: the tool asks before each command it runs.
The checker's prompt
You have not seen how summary.md was made, and you cannotsee the code that made it. Check it. Using R's built-inLifeCycleSavings data and its help page, recompute everynumber in summary.md with your own R code on the full data,and compare every description of a variable with the helppage. Report a table with one row per claim: the claim, whatsummary.md says, what you found, and whether they match(numbers within 0.01). List any claim that data cannotcheck. Do not create or edit any file.
The checker’s report
A test run from the evening before class, recomputed on all 50 countries:
Claim
summary.md
Recomputed, all 50 countries
Match
Number of countries
50
50 rows in the data
✅
Effect of pop15
−0.32
−0.461 (p = 0.003)
❌
Higher income, more saving
0.84, p < 0.01
dpi: −0.0003 (p = 0.72); ddpi, income growth: 0.41
❌
Share of variation explained
38%
R² = 0.34
❌
✅ matches within 0.01; ❌ does not match. Cannot be checked with data: “follow the life-cycle hypothesis”; “checked against the script’s output”. Its guess: the income number may be income growth, from a subset of the countries.
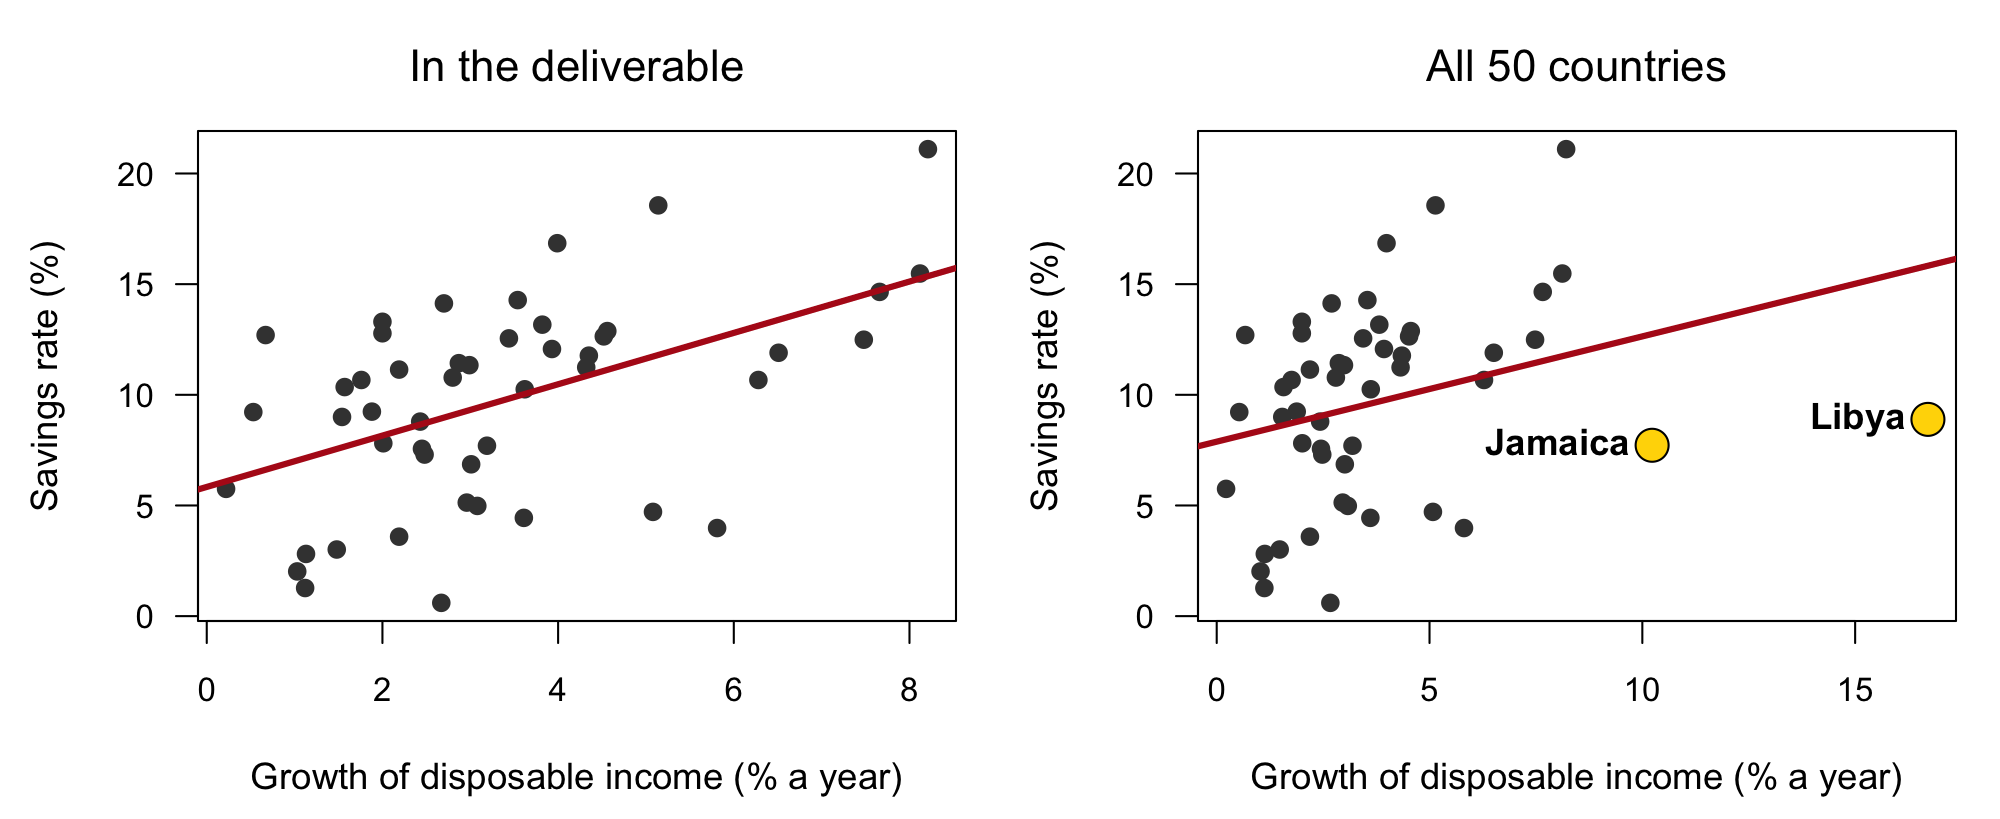
The figure with all 50 countries
Left: the figure from the deliverable, 48 countries. Right: the same plot with all 50; the two countries the script dropped are in yellow. Slope of the fitted line: 1.16 without them, 0.48 with them.
What the three problems were
The summary says
What is true
Kind
Caught by
“the 50 countries”
the model uses 48; line 7 drops Libya and Jamaica
exact
nobs(fit); the envelope
0.84, p < 0.01
0.41, p = 0.04 with all 50
exact
the checker; the envelope
“higher disposable income”
ddpi is the growth rate of income
sourced
the help page
The envelope: 50 countries, and 0.41 on ddpi.
“Checked against the script’s output” is true: every number matches the script, and the script is where the problem is.