Introduction

Data, Coding and Reproducibility
AEM 7010 · Doing Applied Economics Research: Practical Skills

Prof. Ariel Ortiz-Bobea

2026-04-08

Outline

§ Roadmap

  1. Introduction
  2. What is secondary data?
  3. Trends in economic research
  4. Identifying suitable datasets
  5. Preparing next sessions

1. Introduction

A bit about me

§ Section 1: Introduction

  • Prof. Ariel Ortiz-Bobea at Dyson and Brooks Schools. Joined Cornell in 2014.
  • Research focus on how people cope with environmental change. Emphasis on how climate change affects the economy, particularly agriculture.
  • Research group working on environmental and agricultural issues.

Overview

§ Section 1: Introduction

  1. April 8 (W): Introduction (this lecture)
  2. April 13 (M): Reproducibility 1 (with Lars Vilhuber, AEA data editor)
  3. April 15 (W): Reproducibility 2 (with Lars)
  4. April 20 (M): Version control 1 (install Git and create GitHub.com account)
  5. April 22 (W): Version control 2
  6. April 27 (M): AI tools 1 (install claude.ai and subscribe to Pro if possible)
  7. April 29 (W): AI tools 2
  8. May 4 (M): Computing and data resources at Cornell (optional)

Learning outcomes

§ Section 1: Introduction

  1. Familiarity with trends in applied economics research (Session 1)
  2. Understanding of reproducibility standards (Sessions 2-3)
  3. Hands-on version control with Git (Sessions 4-5)
  4. Benefits and risks of AI tools (Sessions 6-7)
  5. Data and computing resources at Cornell (Session 8)

2. What is secondary data?

Definition

§ Section 2: Secondary data

  • Secondary data is collected, processed, and made available by someone other than the researcher(s) conducting a particular study.
  • Contrasts with primary data that is collected by researchers for the purpose of a particular study.
  • Primary data becomes secondary data when reused.
  • Distinction is important for your audience and readers. Generally more details about data gathering in papers based on primary data.
  • Note that what you obtain from scraping or processing existing information is still considered secondary data.

Typology

§ Section 2: Secondary data

  • Who collects it? (government, private entity)
  • How is it collected? (survey, interviews, administrative records, remote sensing, scraping, cell phone tower pings, etc.)
  • How much data is collected? (census, subsample)
  • What is the format? (structured, unstructured)
  • What is the domain? (economic, health, education, natural)

Hamermesh (2025): Six decades of economics publishing

§ Section 3: Trends

“The Demographic and Research Styles of Economics Writing: 2025 Update to Six Decades of Top Economics Publishing: Who and How?

Daniel S. Hamermesh, Journal of Economic Literature 51(1).

Three leading general economics journals from the 1960s through the 2020s. The study tracks levels and trends in author demographics, methodologies, and patterns of coauthorship.

Average author age has risen steadily. Female authorship has risen sharply. Number of authors per paper has risen steadily. Pronounced shift to articles using newly generated data.

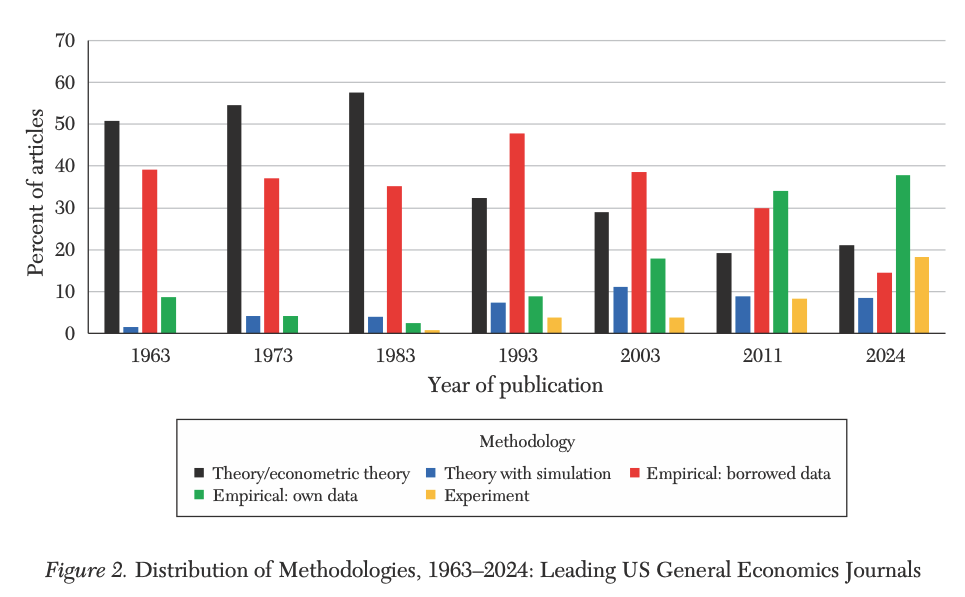
Trend #1: More empirical

§ Trend #1

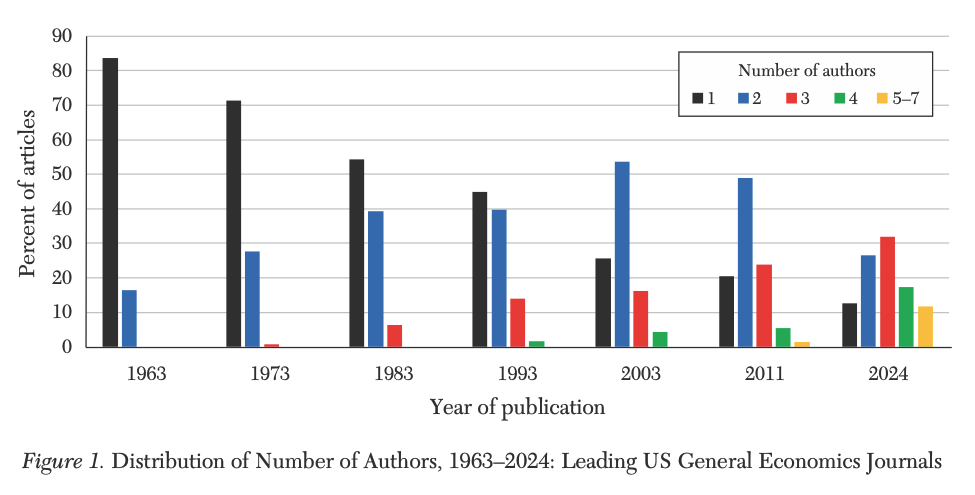
Trend #2: Bigger teams

§ Trend #2

Einav and Levin (2014): Economics in the age of big data

§ Section 3: Trends

“Economics in the age of big data.”

Liran Einav and Jonathan Levin, Science 346(6210), 7 Nov 2014. DOI: 10.1126/science.1243089.

The quality and quantity of data on economic activity are expanding rapidly. Empirical research increasingly relies on newly available large-scale administrative data or private sector data that often is obtained through collaboration with private firms.

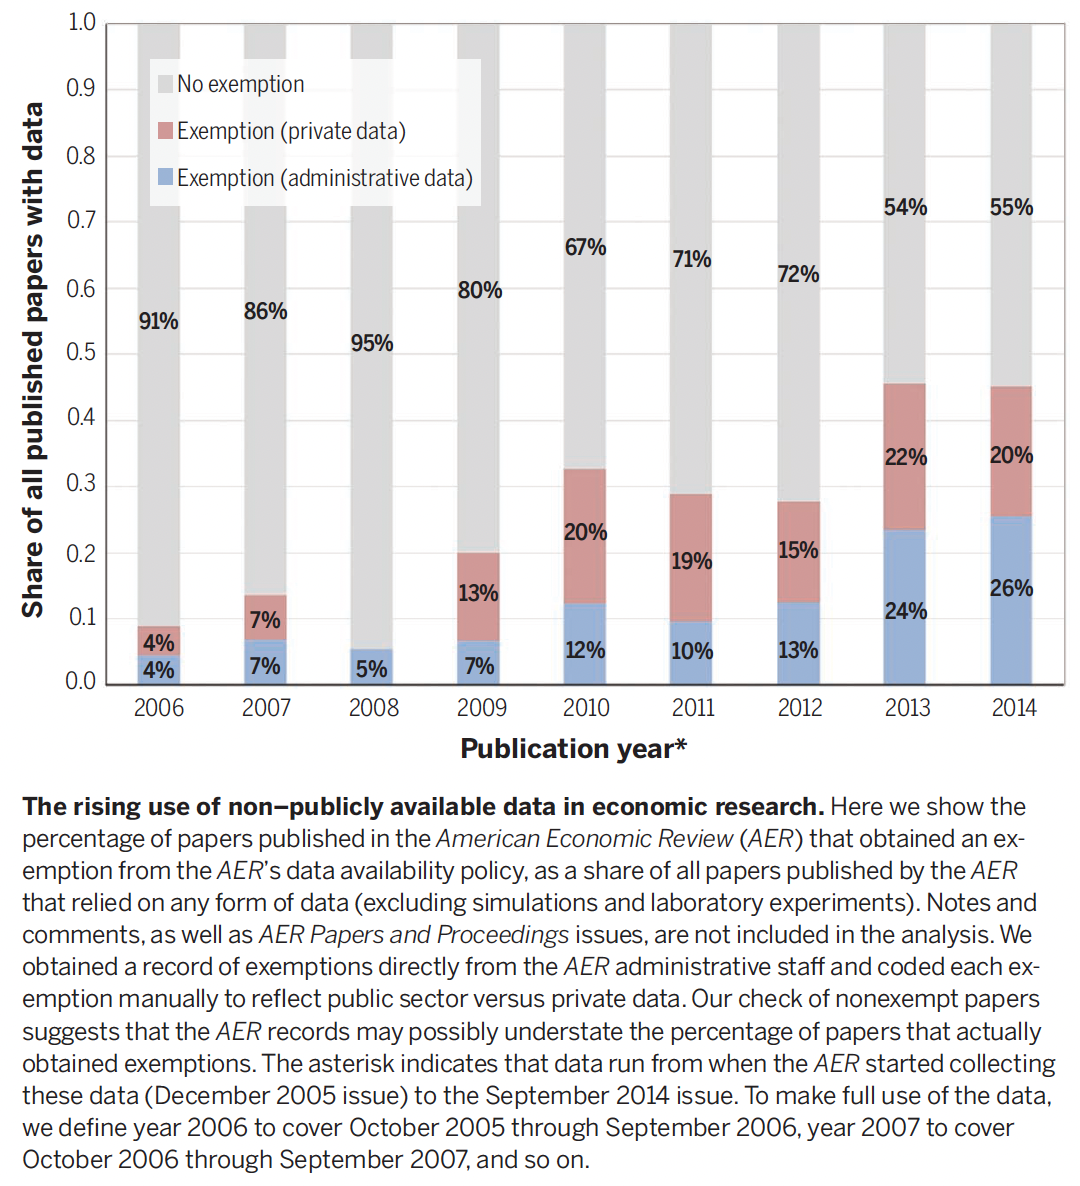
Trend #3: The rise of “complete” restricted and private datasets

§ Trend #3

  • e.g. the Social Security Administration, the Internal Revenue Service, and the Centers for Medicare and Medicaid.
  • But also private companies collaborating with researchers (Ebay, Uber, etc.).

Trend #4: Traditional econometric methods still dominate

§ Trend #4

\[y_i = \alpha + \beta x_i + z_i'\gamma + \varepsilon_i\]

Focus on a few parameters of interest, rather than on model fit (like in Data Science and Machine Learning).

Trend #5: Combining unique and less structured data

§ Trend #5

  • Expanding the use of traditional “complete” datasets to enhance analysis.
  • Example: combine Medicare data with wind direction to instrument for downwind pollution exposure.

Deryugina, Heutel, Miller, Molitor, and Reif (2019). “The Mortality and Medical Costs of Air Pollution: Evidence from Changes in Wind Direction.” American Economic Review 109(12): 4178-4219.

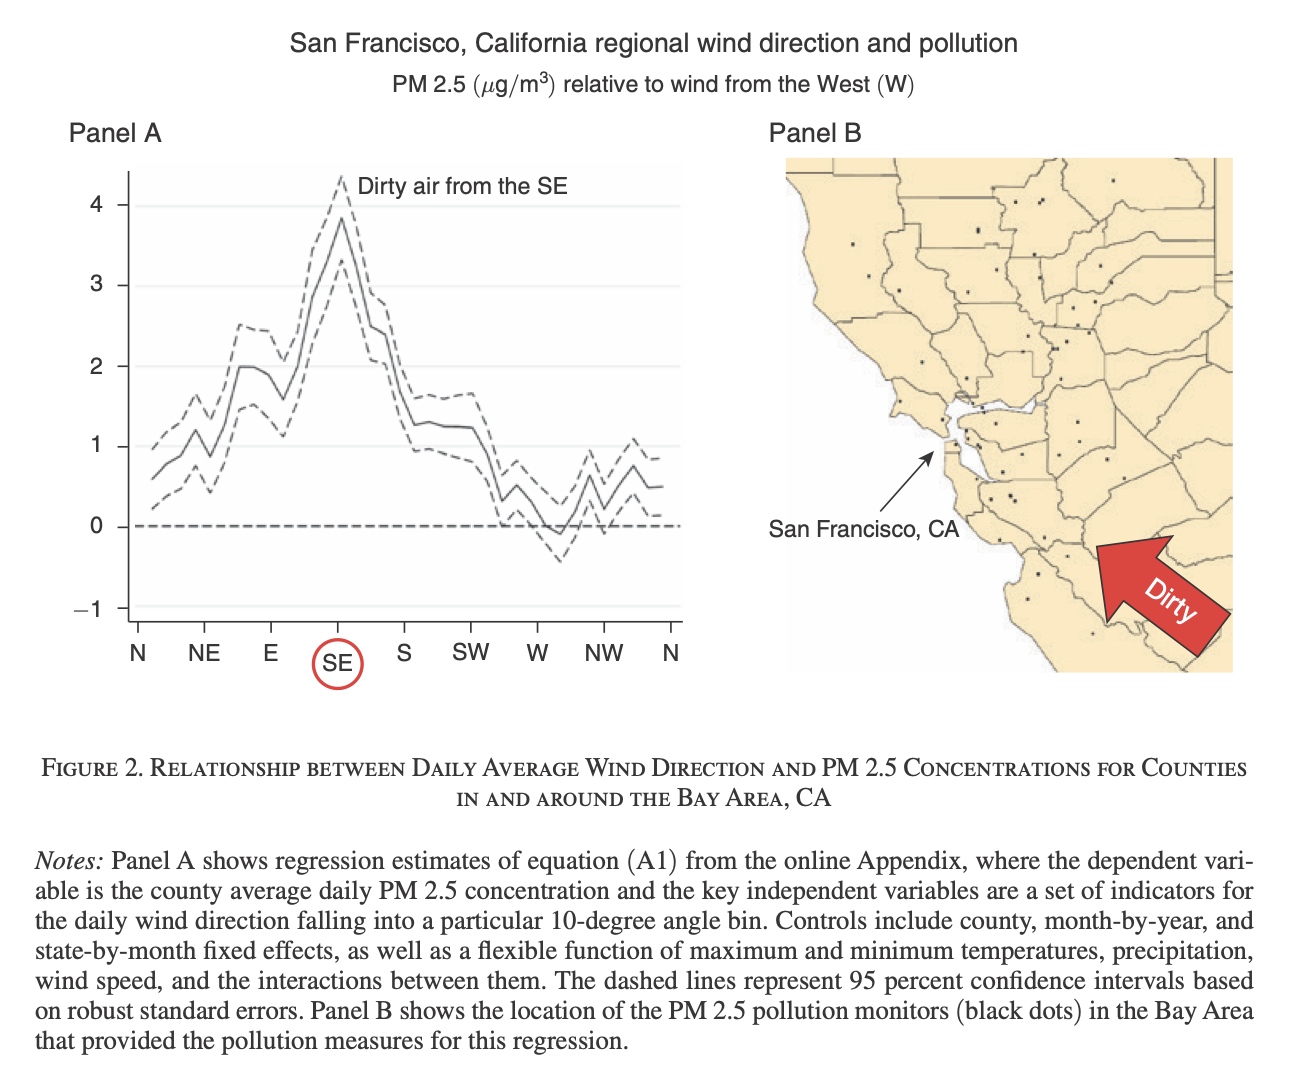
Wind direction as an instrument

§ Trend #5

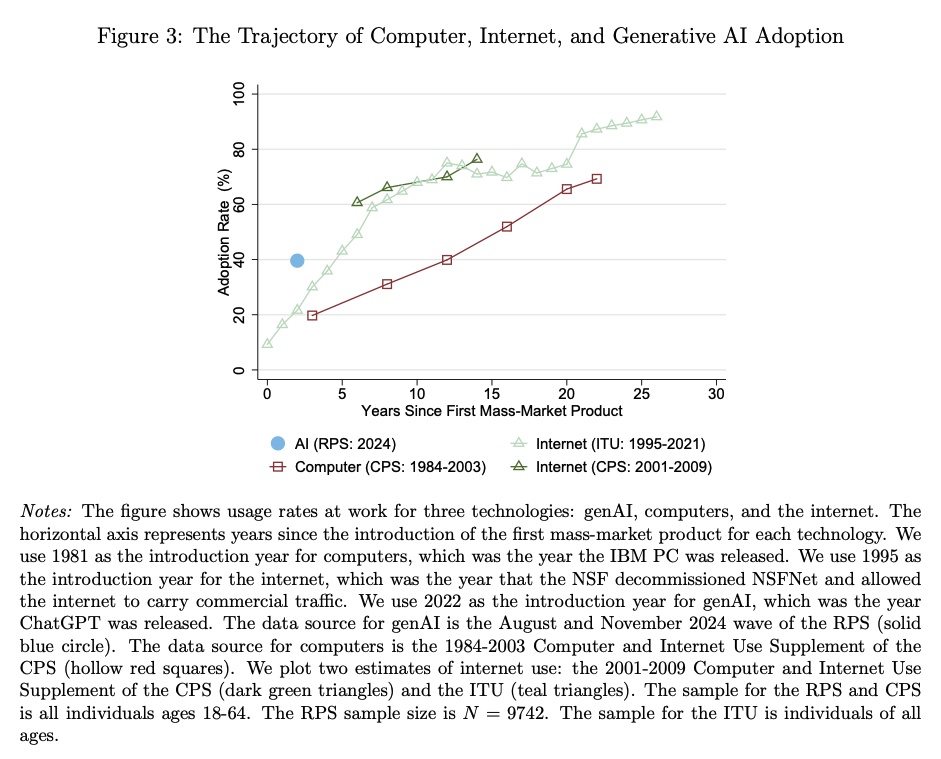
Trend #6: Rapidly rising use of AI tools

§ Trend #6

  • ChatGPT launched in November of 2022.
  • Profession scrambling to adjust to write policies (for papers, reviewers, etc.).

4. Identifying suitable datasets

What is a “suitable” dataset?

§ Section 4: Suitable datasets

  • A dataset that meets necessary conditions for you to analyze the data with a particular set of methods in a rigorous way.
  • Note that suitability depends on the methods.

Threats to suitability:

  • Not the right temporal resolution (e.g. you need monthly, not annual)
  • Not the right level of aggregation (e.g. you need individual not county)
  • Not the right outcome (e.g. you need actual consumption, not reported)
  • Not the right quality (e.g. too much missing data in ways that are difficult to model)
  • Not enough observations (individuals or time periods)

From question to data, or from data to question?

§ Section 4: Suitable datasets

From question to data

  • Research ideas often come before the data.
  • Next steps:
    • What data would allow you to credibly answer this question?
    • Does this “ideal” data exist? If not, do imperfections of the data still allow you to answer the question? Are the caveats too large?

From data to question

  • Sometimes the data comes first.
  • Next steps:
    • What interesting research questions can you answer credibly with these data?
    • Has the data been used before? There is arguably a premium to being the first to ask a good question relative to answering a question with marginally better data or tools.
    • Can I combine these data with other data to answer a novel question?

5. Preparing next sessions

Quick check-in

§ Section 5: Discussion

  • If your laptop died today, could someone reproduce your project?
  • How do you share code with coauthors?
  • Have you used AI tools in your research?

These are the questions that motivate everything we cover from session 2 onward.

Next 2 sessions on reproducibility

§ Section 5: Preparing next sessions

  • Conducted by Lars Vilhuber, AEA Data Editor and Senior Research Associate in the Economics Department at Cornell.
  • Coding assignment:

What’s next

§ Wrap up

  • Monday Apr 13 and Wednesday Apr 15: Reproducibility with Lars.
  • Monday Apr 20: Git fundamentals (laptop required, see the Setup page).
  • Office hours: Wednesdays 2 to 4 pm.

Questions? See the course website or email me at ao332@cornell.edu.